Most organizations can have our dashboard reporting system up and running within 1-2 business days. Our implementation team provides comprehensive setup support, including data source integration and dashboard configuration.
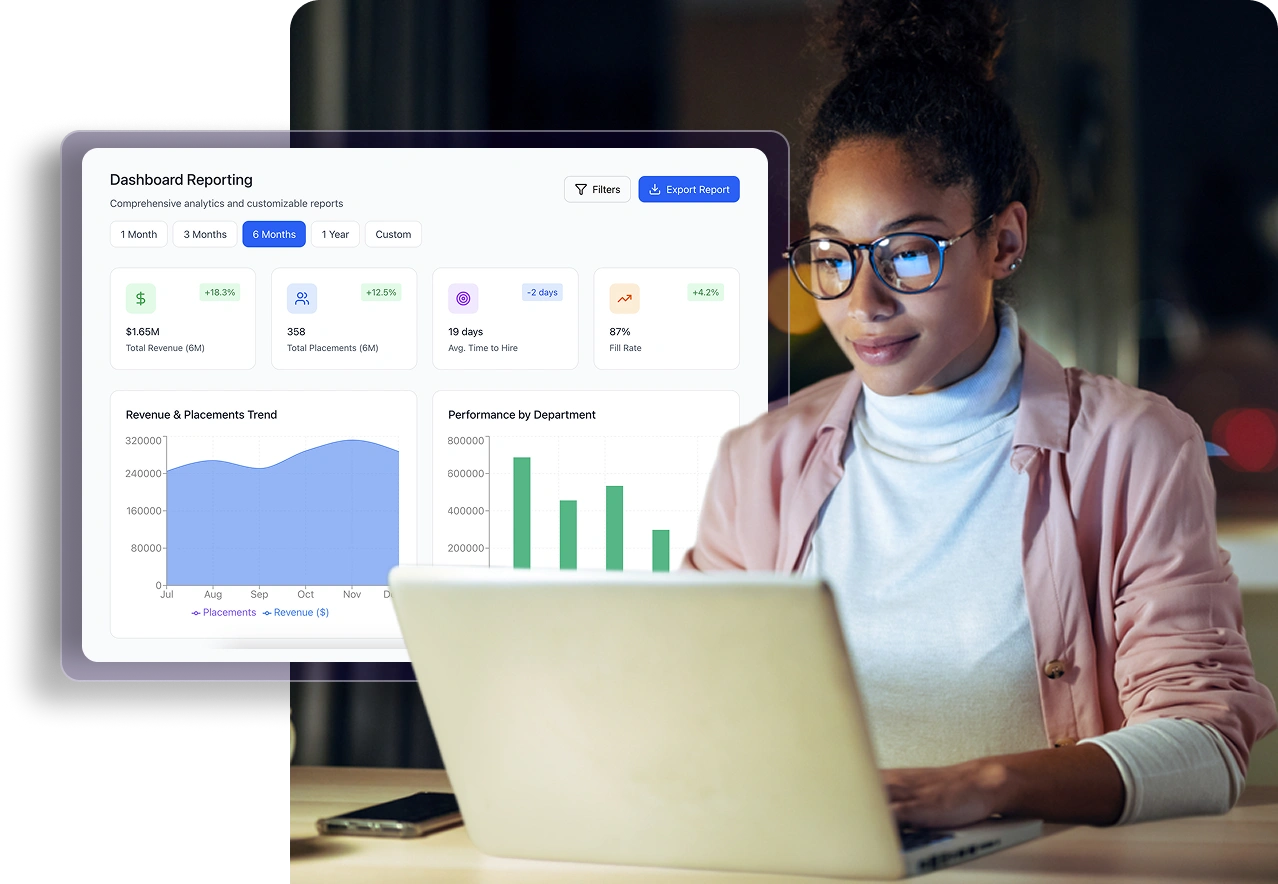
Transform Your Business Data into Actionable Insights
Looking to convert complex data into clear & rich visual stories? Discover our high-powered dashboard reporting software. Our solutions offer everything you need, from real-time business analytics to extensive business intelligence, helping you make data-driven decisions with confidence.
Why Choose Our Dashboard Reporting Software?
With our dashboard reporting software, you can eliminate the need for manual data compilation. The software excels in reducing analysis time, improving productivity, and increasing decision-making accuracy. Our dashboard reporting software is, in fact, the best tool to monitor KPIs (key performance indicators) and other metrics with interactive data visualizations.
-
90% faster data processing and visualization
-
50% reduction in time-to-insight
-
75% improvement in data-driven decision making
-
80% decrease in reporting errors
Features: Why Our Dashboard Reporting Software is the Best!
Our dashboard reporting software combines powerful data visualization, seamless integration, and intuitive design to deliver actionable insights that drive business growth.
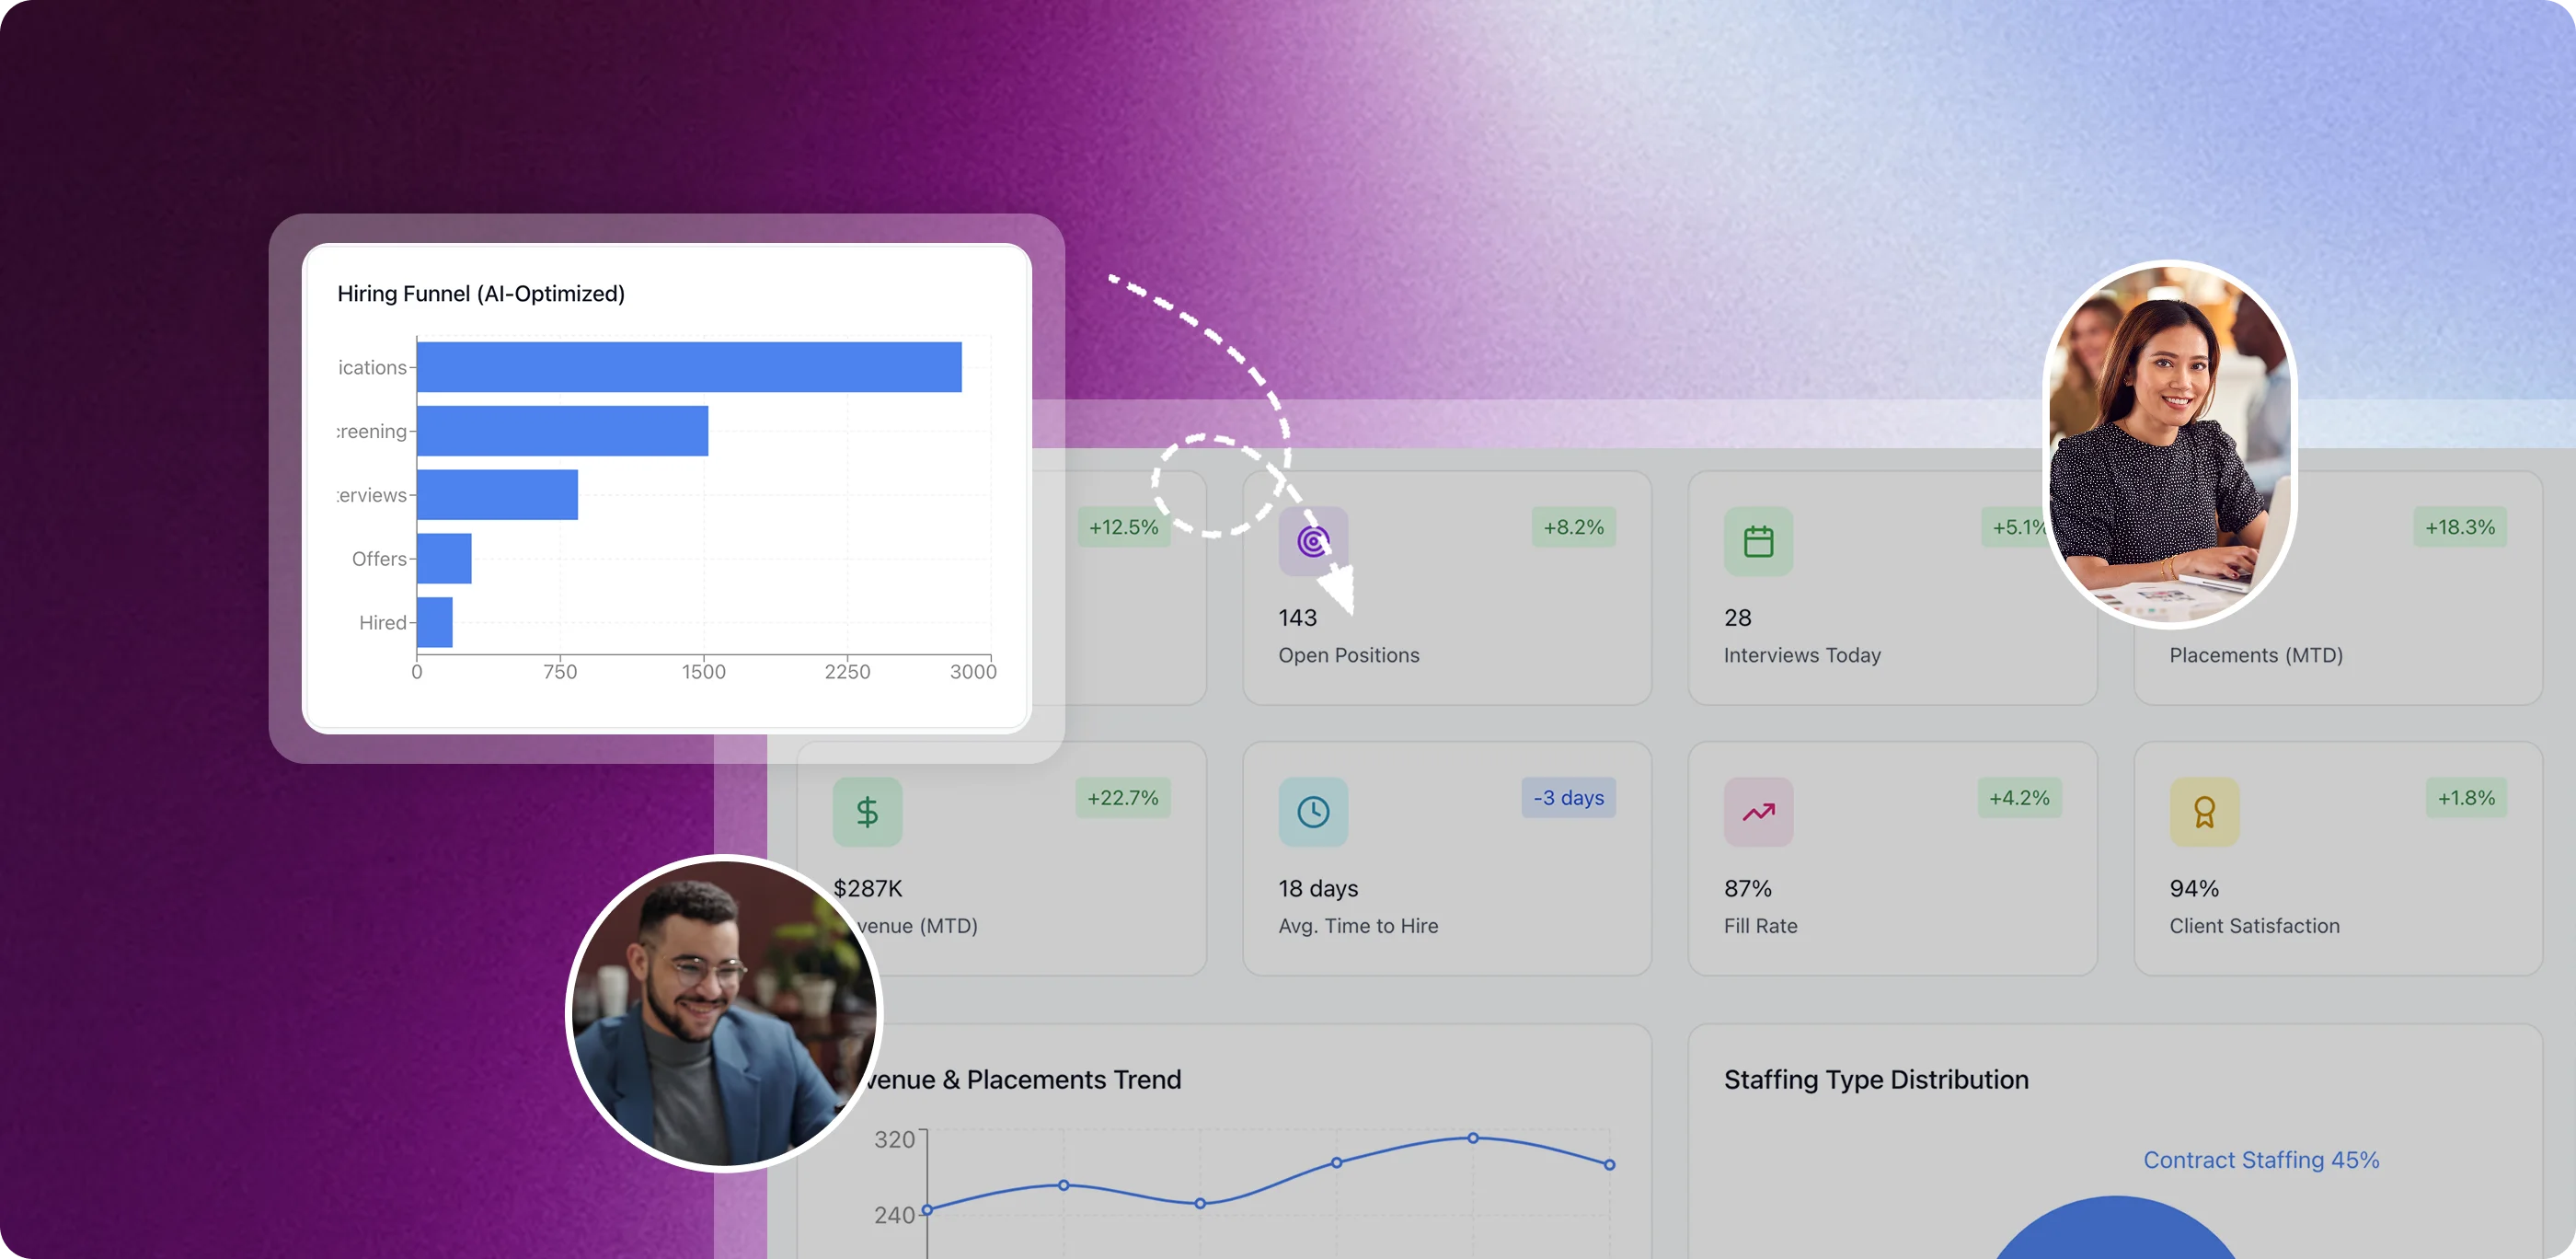
Interactive dashboards featuring Customizable widgets and live data updates
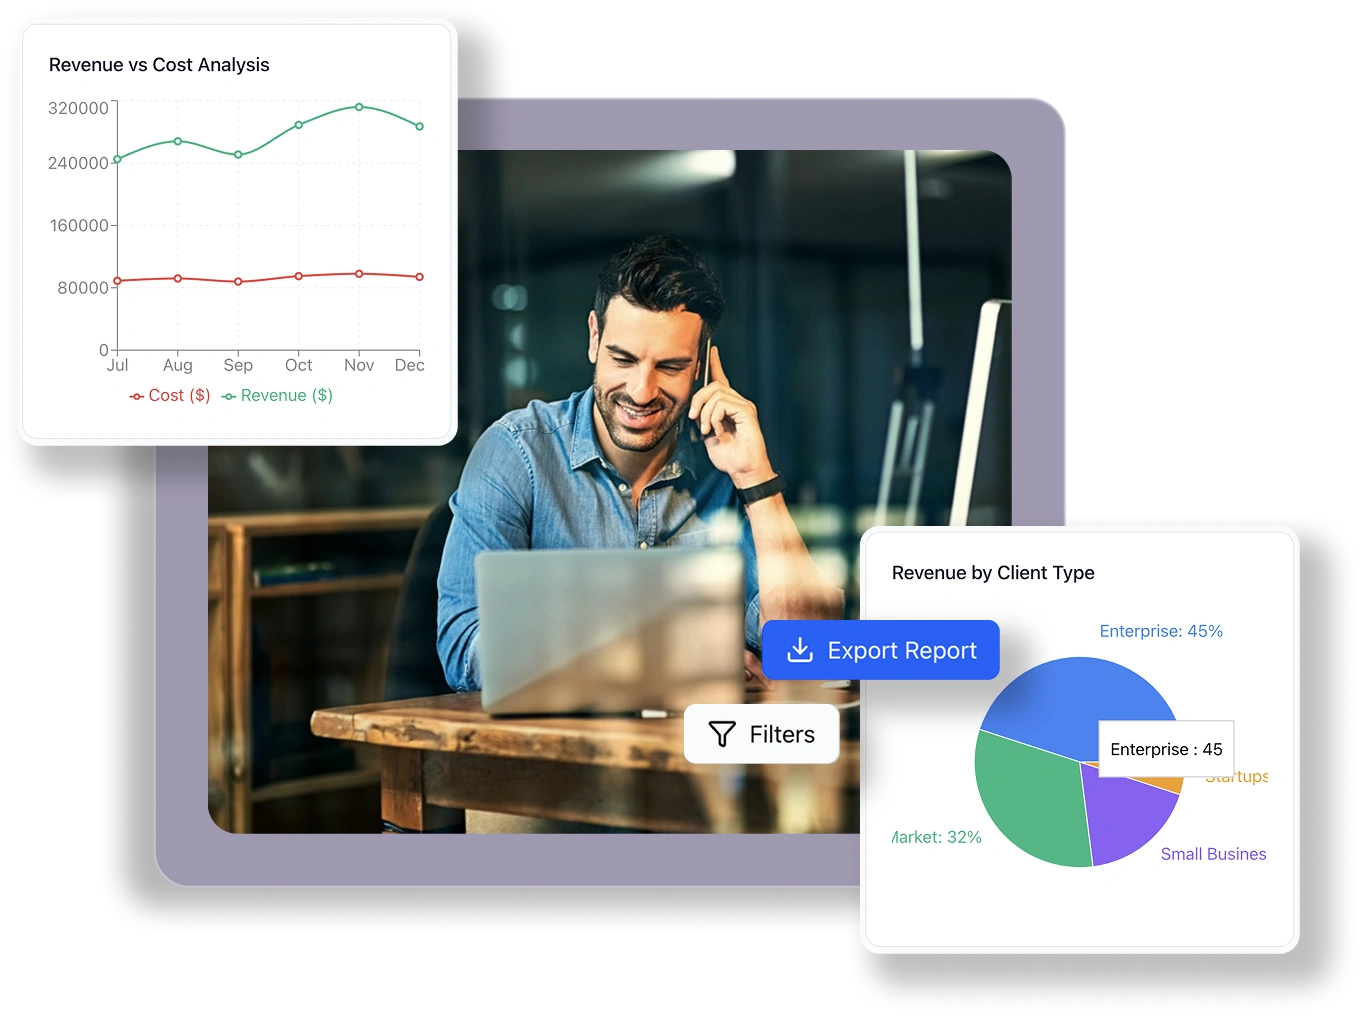
Get advanced data visualization tools such as charts, graphs, heat maps, and more
Our software generates and schedules automated reports for stakeholders
Seamless integration with popular data sources and business systems
Role-based access controls and enterprise-grade security
Mobile-optimized dashboards for on-the-go analytics
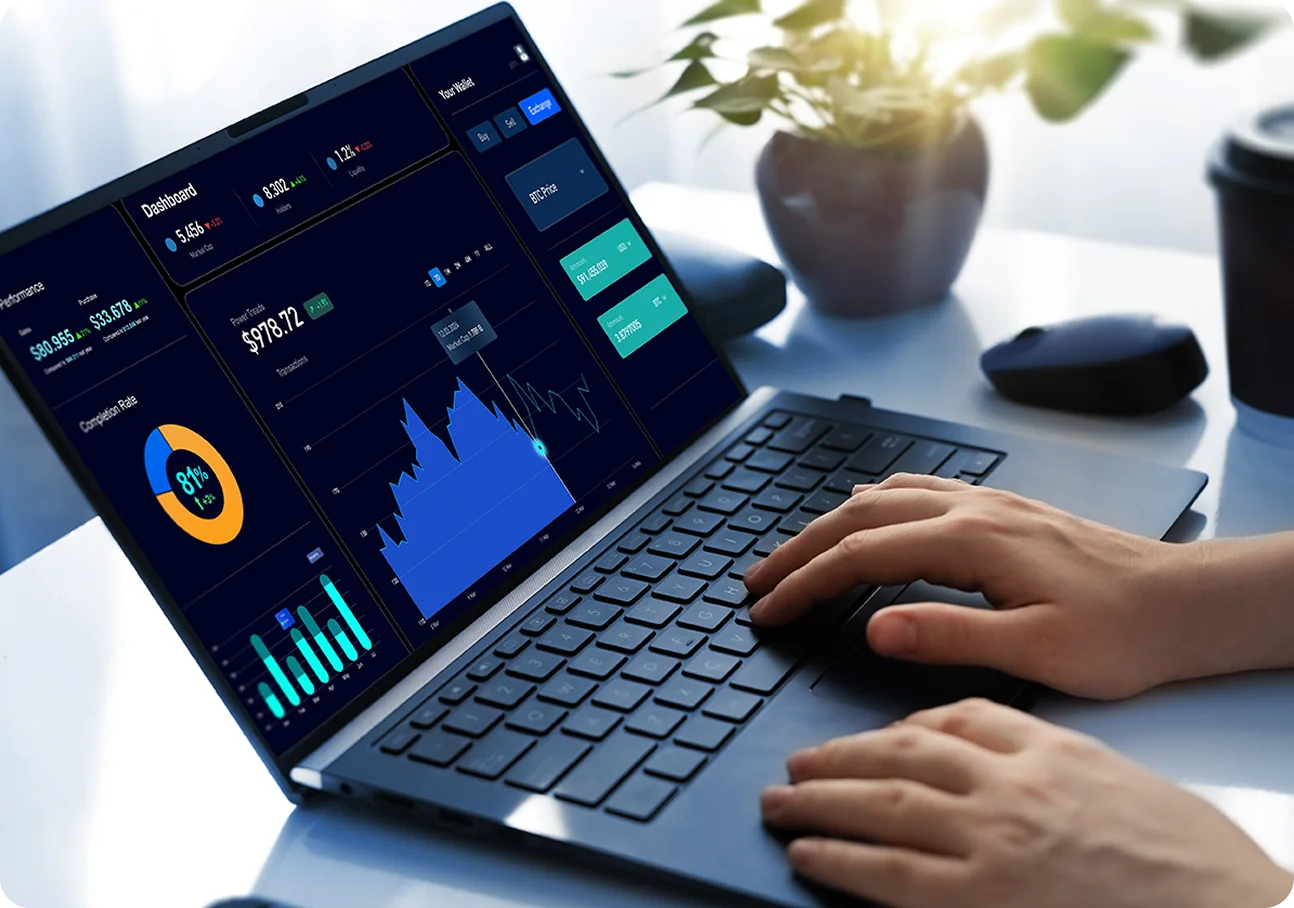
Access Your Dashboards Anywhere, Anytime
- Not at your desk? What you need is a fully functional dashboard reporting system on your mobile device.
- Stay connected to your data whether you're in the office, at home, or traveling. .
- Monitor your business metrics & KPIs through a small-screen version of the dashboard, with a similar quality experience as on a desktop.
How Our Dashboard Reporting System Works
Connect Your Data Sources :
Integrate with databases, spreadsheets, APIs, and more
Design Your Dashboard :
Drag-and-drop interface to create custom visualizations
Share Insights :
Distribute reports and dashboards to stakeholders
Automate & Monitor :
Schedule automated reports and track KPIs in real-time
Optimize Decisions :
Use AI-powered insights to identify trends and opportunities
Ready to Transform Your Data into Insights?
Join thousands of organizations that trust our highly advanced Dashboard Reporting Software and receive nothing less than exceptional business intelligence and data visualization.

Frequently Asked Questions
-
What is dashboard reporting software?
Dashboard reporting software is a digital platform that transforms raw data into interactive charts, graphs, and reports. The platform, ultimately, collects, tracks, and visualizes data to help organizations and stakeholders make informed decisions with confidence.
-
How quickly can I get started?
-
Can it integrate with my existing systems?
Yes, our dashboard reporting software can be integrated with over 100+ popular databases, CRMs, ERPs, and other business systems, including Salesforce, Oracle, Microsoft Dynamics, and more. -
Is the dashboard reporting software mobile-friendly?
Absolutely! Our dashboard reporting software is fully cloud-based and mobile-optimized, allowing you to access your dashboards and reports from anywhere, on any device. -
How secure is my data?
Our dashboard reporting system employs enterprise-grade security, including 256-bit SSL encryption, SOC 2 Type II compliance, regular security audits, and role-based access controls.